
Hector Deville's Best Advanced MT4 Indicator
-
Original Price
*$297*
*Discount Price*
*$47*
Instant download, no limit, no expiry, forever usage
*Price is 47$ for 3 Indicators. Instant download, no limi...
Bollinger Bands
Introduction
Hi, my name is Ty Young with www.surefire-trading.com. And as the newest member of the team, I would like to take a moment to introduce myself.
I am a Technical Analyst. This means, as a trader, it is my position that all action and reaction of the markets – all the fundamentals - are exclusively expressed within the charts. I am NOT saying that there is no place for the fundamentals, I am saying that the fundamentals determine the price – and the price dictates the technical data. So, we allow the price to determine our direction.
It is my goal, here at Sure-fire Trading; to assist you in developing the skills required to become a successful trader.

It is my goal to teach you how to analyze the charts - to teach you how to recognize “High Probability” trades.
As traders, what we do is a blending of chart mechanics and art. I will provide you with the mechanics portion; however, through experience and hard work, you must develop the artistic side of trading. Then and only then will you be able to tame the beasts that haunt every trader – FEAR and GREED.
It is my intention to provide you with the tools that will enable you to trade with CONFIDENCE. So, in the lessons to follow, repeatedly, my emphasis will be - “READ THE CHARTS.” If you hear me say it once, you will hear me say it a million times, “READ THE CHARTS”.
We are not fortunetellers. We are not in the business of predicting the direction of the market. We do, however, interpret the data provided to us by the charts – we then, trade accordingly. When the charts say buy – we go long. When the charts say sell – we short the market. If it’s not saying a thing – we do not trade. PERIOD. So, having said all that, let’s talk a bit about Bollinger Bands.
History
One of my most favorite indicators is the Bollinger Bands. Deriving its name from its founder, John Bollinger takes advantage of price action and volatility to create a picture that helps define the highs and lows of the market. And can even identify reversals within the market.
Like all innovative tools, they find their heritage in the successes and failures of those who have gone before them. John Bollinger, has developed an indicator that has evolved from his knowledge and understanding that he derived from men like Wilfrid LeDoux (the Twin-Line Chart); Chester W. Keltner (Keltner Channel); Richard Donchian (Donchian Channel); Geraldine Weiss (IQT); J.M. Hurst (Timing and Trading Cysles), and the like.
Technical
Bollinger calculated long-term deviation and used it to set percentage bands – in essence an adaptive version of percentage bands (source: Bollinger on BollingerBands by John Bollinger, McGraw-Hill, 2002). Most charting software calculates these bands – but for those of you who have an itch to calculate for yourselves, here’s the formula:
- Find the simple moving average:

- Having found the SMA, then calculate as follows: a)
 b)
b) 
Charts
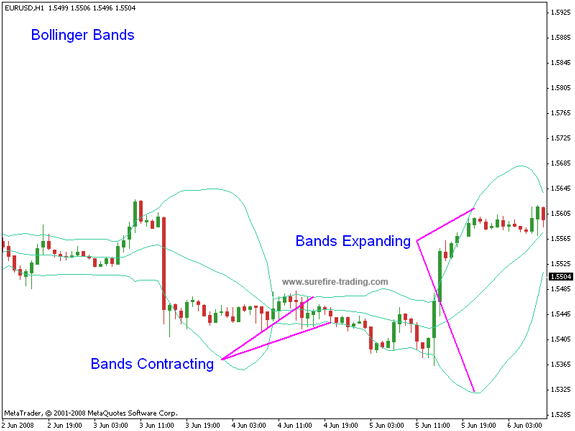
In the chart below, one of the first things that we notice about Bollinger Bands is that the price always moves from one extreme to the other. In other words, once price action has run its course at the lower band, it will eventually make its way to the upper band – and visa versa.
- As we analyze a particular chart, we are initially looking for the bands to contract - showing low volatility; subsequently, we are looking for the bands to expand – demonstrating high volatility. We want to trade during times of higher volatility.
- Constricted bands are like a person who is canoeing on a slow-moving stream – he has to work so much harder to reach his destination. However, put the same canoe in a fast moving river and a fraction of the effort is emitted - demonstrated by the expansion of the bands.
- This is precisely what we are looking for in the Bollinger Bands – this is a “high probability” signal.
False Breakout
- In looking for an entry opportunity, always watch for signs of a false breakout – I will guide you within the scope of each lesson regarding false breakouts but you will find, in each case, that experience will be your best teacher.
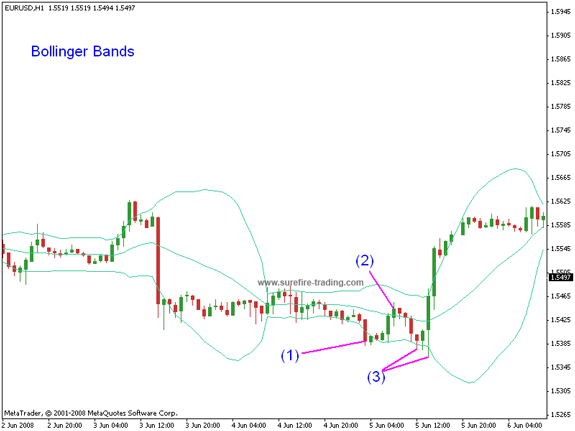
- As the bands begin to widen, we are looking for a close above the upper band or below the lower band.
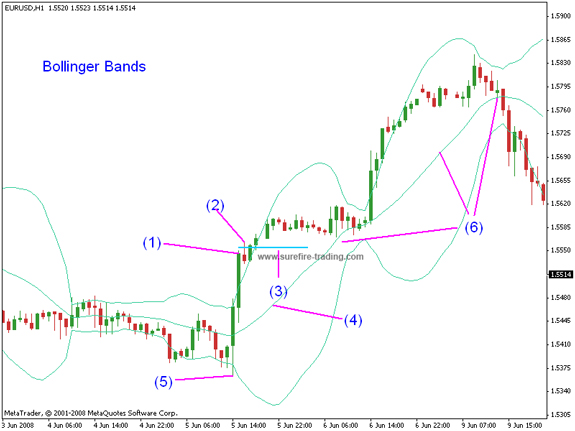
- In the following chart, we have a close below the lower band (1) providing us with a signal for a potential short trade.
- However, as the price began to retrace, it closed above the 20 SMA (2) signaling a potential reversal to the bullish side.
- As the price began to fall again, we have three consecutive breaks of the lower band with NO subsequent closes of any kind below the lower band (3) – discounting a short trade. We now wait for the market to prove itself, again….patience.
A Conservative Trade
- A close outside the upper band, candle (1), signals a potential long entry.
- Since candle (1) has closed above the upper band, we immediately place a buy/stop order one pip above the high of candle (1) (if price is moving too fast to accommodate a buy/stop order, then jump in with two feet with a buy at the market).
- As candle (2) begins to rise, it easily breaks the previous high by 13 pips - and we have entered the market with a long position at level (3).
- Immediately upon entry of the market, our protective stop is placed a few pips below the 20 SMA (4) or (for an aggressive stop) below the low of the candles that broke the lower band after the bands began to widen (5).
- Using the same principle, as the price continues in your favor, a trailing stop can safely be placed a few pips below the 20 SMA (6).
An additional Indicator with Trend lines as Confirmation
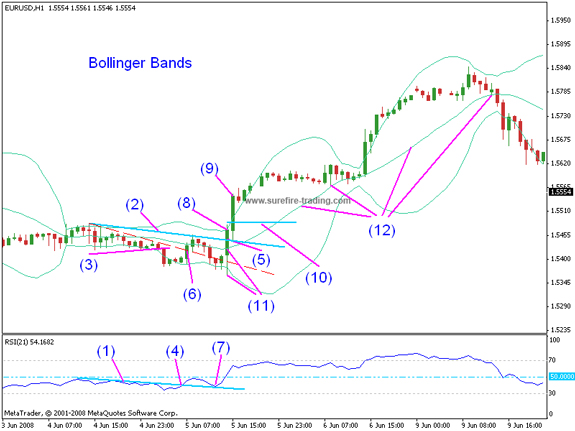
- In this example, I have added the Relative Strength Indicator (RSI) with a setting of 21 and two sloping trend lines (1) and (2) to aide us in providing a higher probability trade and greater confirmation to the Bollinger Bands.
- Now, some of you immediately may wonder why I am not using trend line (3) (the red dotted line) as my price trend line – and “cheers” to you for questioning. Remember, the false breakout previously mentioned – it was a failed entry, so we are past this point - so, moving along.
- When using a trend line (1) within an indicator relative to a price trend line (2), remember to draw the lines in close relationship to each other. As you can see in this example, the RSI trend line (1) is directly below the price trend line (2) above.
- Also, remember to compare apples with apples – when comparing two trend lines (one on a price chart and one within a separate indicator), make sure that the one trend line is drawn relative to the other – DO NOT draw a trend line on the peaks of a price chart in order to compare it to a trend line within an indicator drawn on the dips.
Now, let’s take a look at how to use this to signal a high probability entry.
- Once trend line (1) and trend line (2) are broken (that’s “and” not “or”), we have a signal that a possible trade is developing - in this case, at points (4) and (5).
- Now, if you look at the trend line break (4) on the RSI, you will see that it correlates with the trend line break (6) on the price chart (the red dotted line that we have discarded) which, as I said previously, we generally do not do; however, because the RSI pulled back at point (7) to trend line (1) without breaking below it, it is still a legitimate break to the bullish side.
Now, here comes the meat…..
- Since RSI has not broken below the trend line at point (7), a close of candle (8) above the price trend line (2) provides us with the added confirmation we were waiting for.
- Once candle (8) closed, a buy/stop order can immediately be entered one pip above the high of candle (9).
- As candle (9) begins to rise, it easily surpasses the previous high of candle (8) by 71 pips - and we have entered the market with a long position at level (10). Pretty cool, huh?
- Immediately, our protective stop would be placed below the low of the candle (8) or below the 20 SMA (11) – depending on how aggressive you are in your trading.
- As the price continues in your favor, a trailing stop can safely be placed a few pips below the 20 SMA (12).
Adding to Your Position
Knowing that it is best to “let your profits run”, let’s look at the chart below to see how Bollinger Bands can aide in this strategy.
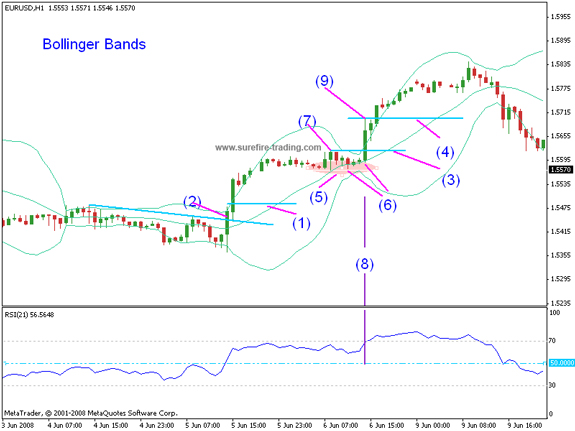
- Now, let’s assume that you have already entered a long position at level (1) because of the candle (2) that closed above the trend line (described in the “meaty” section above).
- Level (3) or level (4) would be the perfect place to add to your position. And here’s why…..
- Because I said so, that’s why…..yes, mother dear. LOL.
- Haha, here’s the real reason:
- Let’s first look at entry level (3). Of all the candles in cluster area (5) that broke below the 20 SMA, only one closed below the 20 SMA – and insignificantly, at best.
- In addition, each of the lows of the candles in area (6) was increasingly higher than the previous candle.
- As added confirmation, the RSI reading (8) directly below the candles of area (6) was considerably above the 50-line.
- A buy/stop order would easily have been entered one pip above the high of candle (7).
- With candle (9) easily moving upward a fantastic 83 pips, we had no problem adding to our long position.
- And since candle (9) closed outside the upper Bollinger Band (described above in the section “A Conservative Trade”), we had the perfect entry signal at level (4).
- As price moves in your favor, protect your profits with trailing stops as described earlier.
Click To Play The Video
Click To Play The Video
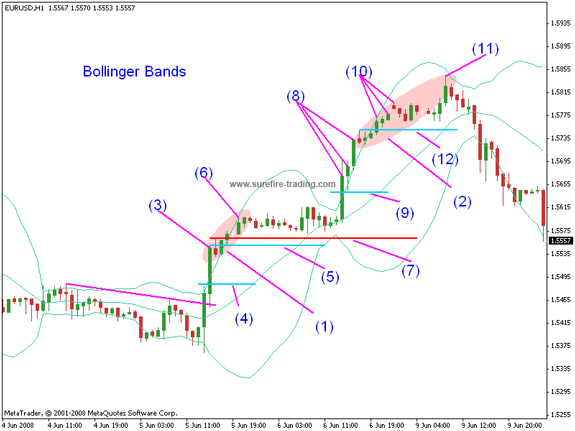
Bollinger Band Reversal Signals
Now, this is where Bollinger really, really shines - and why it’s my most favorite indicator - so follow me closely here. During times of high volatility, price has a tendency to “walk” (and sometimes “run”) up/down the upper/lower bands. A close outside the band with a subsequent break and close inside the band can be a strong reversal signal – or a strong continuation signal. Now, before you walk away thinking, “This guy’s a bubble off plumb” – stay with me a bit longer.
Let’s look at cluster area (1)
- We have a close with candle (3) outside the upper Bollinger Band providing a signal to enter long (as described earlier in this lesson).
- So, if you’re not long already because of level (4), you will surely be in the market on the long side now, at level (5).
- OK, here it is; candle (6), as expected, moves higher than the high of candle (3) – but something interesting happens here. Candle (6) closes inside the upper band – signaling a possible reversal (the operative word being – “POSSIBLE”).
- Immediately - I move my trailing stop to a position that is a couple of pips above where I entered long (or may have added to my position) – red line (7), in order to protect my first and second entry.
- However, the price fails to reverse, as expected (with no complaints), which would have been indicated by a drop below the 20 SMA – a victory for the bulls. And we remain in a long position.
Cluster area (2)
- Once the price again closed outside the upper band within cluster area (2) with candles (8), I am adding (if I’m feeling real brave) to my position and my trailing stop is moved to position (9) – to the low of the second candle within cluster (8). Moving your stops at this point becomes a matter of equity and confidence – and is placed at the trader’s discretion. Don’t get GREEDY!!!
- But low-and-behold, look what happens again; the candles (10) have moved higher than candles (8) but have closed inside the upper band – once again signaling a potential reversal.
- However, knowing from experience, that often times a close outside the bands with a subsequent close inside the bands can be followed by a final “thrust” (11), I elect not to exit but I immediately move my trailing stop to protect my profits at level (12) – not too close, as to leave opportunity for the thrust upward. I then can decide to exit after the final thrusting action (11) or move my trailing stop to the 20 SMA. In either case, we are out of the market with a tremendous gain – and my Sweetie gets a night out on the town :o)
- Now, this is trading. WOWSER!!
Please take note, at this point; I have used the word “possible” in describing the potential reversals. Why is that? It is because, until the price closes outside the opposite band, the reversal is not confirmed.
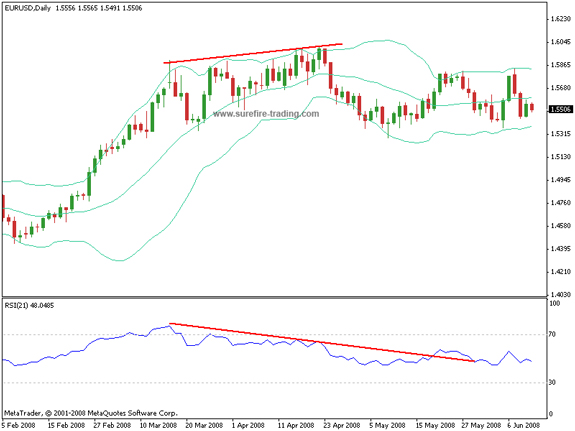
The price can continue to walk the band virtually indefinitely (or so it seems). And can even close across the 20 SMA and the trend can remain intact. Until the price crosses the opposite band, there is a higher probability that the trend is intact.
Also, the higher the time frame, the greater the credibility. For example, in this Daily chart below, the price walked the upper band for over 1000 pips and had an overall bullish move for over 1600 pips.
So, trader – beware. RSI divergence provided a great signal that this bullish trend possibly was completed – However, we will save that for the next lesson.
With surefire-trading.com, this is Ty Young, reminding you to “Read the Charts” – and have some fun doing it…….
Ty Young
surefire-trading.com